

Forecasting our climate future
To adapt to our changing climate, we need a vision of what the future will look like. Science-based scenarios can help.

If we’re to adapt to our changing climate and to increase our resilience to the impacts of climate change, we need to have at least a reasonable idea of what our future climate might look like. We need to know what future to prepare for.
However, when it comes to our climate, the future is inherently uncertain. We don’t know what we’re going to do when it comes to greenhouse gas emissions. We don’t know how the climate will respond. And we don’t know how the myriad complexities that make up our climate systems will interact with each other.
But we can’t just wait around to see what happens. We need a way of cutting through the uncertainty and of getting a feel for what the future might hold. This is where climate scenarios come in.
Determining plausible futures
In planning terms, a scenario is a broad-brush idea of a potential future. It’s descriptive in nature and brings together a range of relevant factors that play a role in determining what the future might look like.
Scenario planners usually posit a suite of scenarios, depending on how they think things will pan out. Such scenarios are not definitive. And they don’t usually come with probabilities attached. But they do, at least, help to get us thinking about what the future might look like and how we might respond in each of the scenarios highlighted.
To determine a suite of plausible scenarios, we need to understand the main factors that will influence what the future might look like. When it comes to climate change, the key determinant of current and future climate impacts is global temperatures. And these are driven by greenhouse gas emissions and the concentration of such gases in the atmosphere.
Consequently, the most commonly-used climate scenarios tend to focus on these factors. After all, there’s a clear scientific consensus that greenhouse gas emissions are driving global temperature rises. We have a good understanding of the relationship between emissions, temperatures and a range of other climate-related factors. And researchers have developed powerful models that allow us to quantify the impact of a range of emissions trajectories on our global climate.
Emissions trajectories
We’ll look here at three popular sets of climate scenarios, which feature prominently in the way scientists and governments think about how our future might look. I’ll also highlight a fourth approach, which I really like because it looks at things in a slightly different way.
The first set of climate scenarios has been developed by the Scenario Model Intercomparison Project (ScenarioMIP), which is part of the World Climate Research Programme’s Coupled Model Intercomparison Project.
The ScenarioMIP approach proposes a series of likely future emissions trajectories, i.e. how we increase or decrease our greenhouse gas emissions over time. Researchers engaged in the project then run supercomputer-driven climate models that simulate the physics, chemistry and biology of the Earth’s atmosphere, land and oceans. This allows them model impact of these emissions trajectories on global mean surface temperatures.
The ScenarioMIP project focuses its analysis on seven potential emissions trajectories:
High (H): We roll back current climate policies and greenhouse gas emissions increase.
High-to-low (HL): Emissions rise at first, but are cut sharply in the second half of the century to reach net-zero by 2100.
Medium (M): Emissions remain consistent with current climate and carbon-reduction policies.
Medium-to-low (ML): Emissions are reduced slowly, eventually reaching net-zero emissions by the end of the century.
Low (L): Emissions are held at a level that is consistent with keeping warming below 2 degrees Celsius.
Very low (VL): Emissions are cut to a level that limits warming to close to 1.5 degrees Celsius by the end of the century, with limited overshoot beforehand.
Low-to-negative (LN): Emissions fall slightly slower than in the VL scenario, with temperatures just rising above 1.5C. Emissions then drop rapidly to negative to bring warming back down.
You’ll note that that the descriptions of the latter three of these scenarios (which I’ve paraphrased here for the sake of clarity) define the emissions trajectories in terms of their impact on global temperatures.
This seems like a bit of a cop-out, really, as these trajectories have evidently been created by working backwards from the desired result. But I can understand that the researchers are keen to include scenarios that reflect the 1.5 and 2 degree warming targets that form a key part of many countries’ climate policies.
The modelling of these scenarios yields the following results. The chart on the left shows the emissions trajectory in each scenario and the chart on the right shows the likely increase in global mean surface temperature above the pre-industrial average.
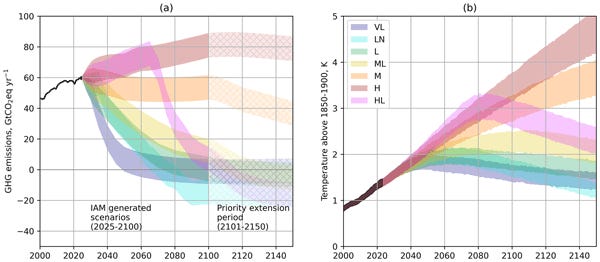
Source: Van Vuuren, D. P. et al. (2026) The Scenario Model Intercomparison Project for CMIP7 (ScenarioMIP-CMIP7), Geosci. Model Dev., 19, 2627–2656.
For example, the ‘High’ emissions trajectory is projected to result in a temperature rise of about 3-4 degrees by 2100 and 4-5 degrees by 2150. And all of the emissions trajectories project a temperature rise of more than 1.5 degrees (albeit in some cases only temporarily), which is regarded as ‘safe’ level of global warming.
Something important to note is that these – and other – climate scenarios don’t tell us what we should be doing. They simply provide us with information on the likely impact of different emissions trajectories on future global mean surface temperatures. What we and our governments choose to do with this information is up to us.
Concentration pathways
The second set of climate scenarios has been created through the use of Representative Concentration Pathways (RCP), which have been developed collaboratively by a multidisciplinary team of scientific researchers and social scientists.
The RCPs differ from the emissions trajectory scenarios outlined above in that they focus on the concentration of greenhouse gases in the atmosphere and its impact on what’s known as radiative forcing, which is a measure of the change in the balance of energy flowing into our planet’s atmosphere.
In broad terms, an increase in greenhouse gas concentrations leads to an increase in radiative forcing, which in turn leads to higher global temperatures.
There are four RCP scenarios, which (in case you’re interested) are named after the expected changes in radiative forcing values (in watts per square metre) in each scenario from the year 1750 to the year 2100.
The four scenarios, the descriptions of which I’ve paraphrased slightly for clarity, are as follows:
RCP2.6: Radiative forcing peaks at ~3 W/m2 (~490 ppm CO2 equivalent) before 2100 and then declines to 2.6 W/m2 by 2100.
RCP4.5: Radiative forcing rises and then stabilises at 4.5 W/m2 (~650 ppm CO2 equivalent) after 2100. This is the most probable baseline scenario (i.e. what happens if we don’t implement any climate policies), taking into account the fact that we’ll (presumably) run out of fossil fuels at some point.
RCP6.0: Radiative forcing rises and then stabilises at 6 W/m2 (~850 ppm CO2 equivalent) after 2100.
RCP8.5: Radiative forcing rises to 8.5 W/m2 (~1370 ppm CO2 equivalent) by 2100. This is generally taken as the basis for worst-case climate change scenarios. There is, however, suggestion that this scenario is no longer plausible, given global pressure to reduce emissions.
This is how the different scenarios look in terms of greenhouse gas concentrations. Each of the three charts below looks at a different greenhouse gas: carbon dioxide (CO2), methane (CH4) and nitrous oxide (N2O). The overall impact is, of course, cumulative.
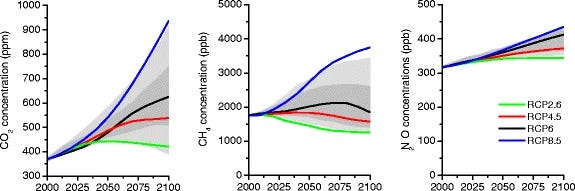
Source: van Vuuren, D.P. et al. (2011) The representative concentration pathways: an overview, Climatic Change 109, 5.
Climate modellers suggest that the likely impact of each of these scenarios on global mean surface temperatures (by around 2100) would be as follows. The figures in brackets represent the range of plausible temperatures generated by the underlying models.
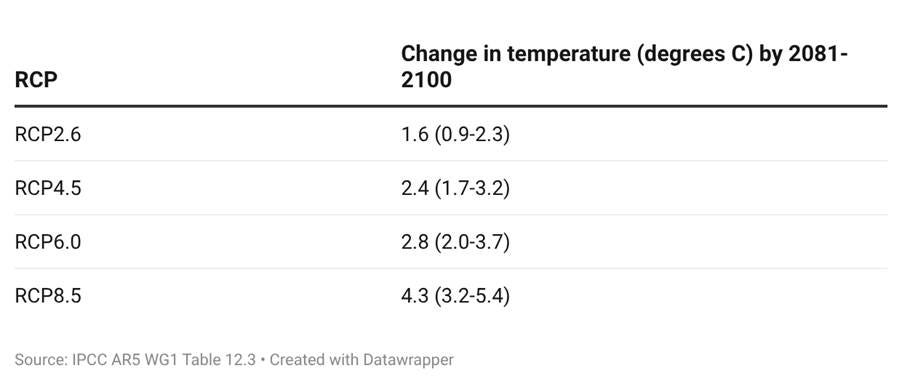
Here are the potential ranges of temperature increases for each of the scenarios shown visually:
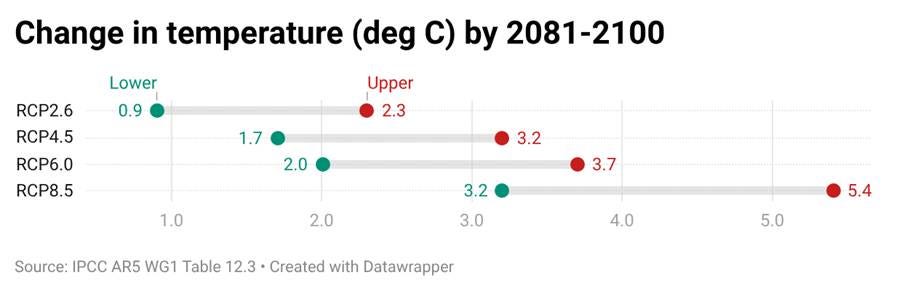
There are obviously clear links between the two sets of scenarios discussed so far, as they’re ultimately both driven by greenhouse gas emissions. And it’s clear that, as you would expect, the two sets of scenarios paint a fairly consistent picture of potential global mean surface temperatures at the end of this century.
Socioeconomic pathways
The third main set of climate scenarios comes at things from a different direction. The Shared Socioeconomic Pathways are a suite of scenarios that were set out in the Sixth Assessment Report of the United Nations Intergovernmental Panel on Climate Change (IPCC).
Rather than focusing on the impacts of our actions on greenhouse gas emissions and concentrations, the Shared Socioeconomic Pathway (SSP) scenarios focus on our actions themselves. In doing so, they’re essentially taking a step back from the drivers of the scenarios discussed previously, to think about how we got there in the first place.
There are five SSPs. I’ve summarised the definitions, because the ones used by the IPCC are quite lengthy.
SSP1 Sustainability / Taking the green road: The world shifts gradually, but pervasively, toward a more sustainable path, emphasizing more inclusive development that respects perceived environmental boundaries.
SSP2 Middle of the road: The world follows a path in which social, economic, and technological trends do not shift markedly from historical patterns.
SSP3 Regional rivalry / A rocky road: A resurgent nationalism, concerns about competitiveness and security, and regional conflicts push countries to increasingly focus on domestic or, at most, regional issues.
SSP4 Inequality / A road divided: Highly unequal investments in human capital, combined with increasing disparities in economic opportunity and political power, lead to increasing inequalities and stratification both across and within countries.
SSP5 Fossil-fuelled development / Taking the highway: This world places increasing faith in competitive markets, innovation and participatory societies to produce rapid technological progress and development of human capital as the path to sustainable development.
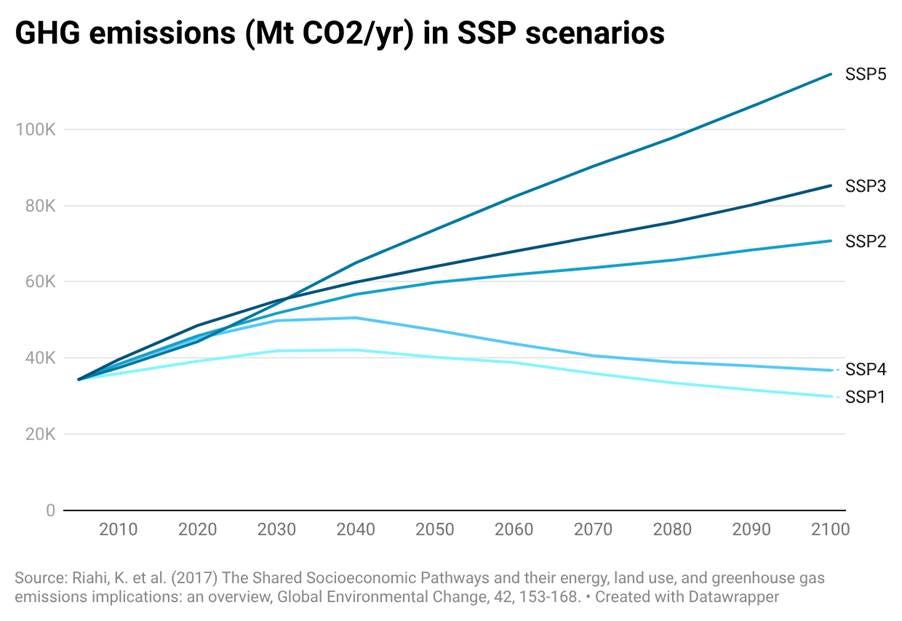
The likely impact of each of these scenarios on atmospheric CO2 concentrations is as follows:
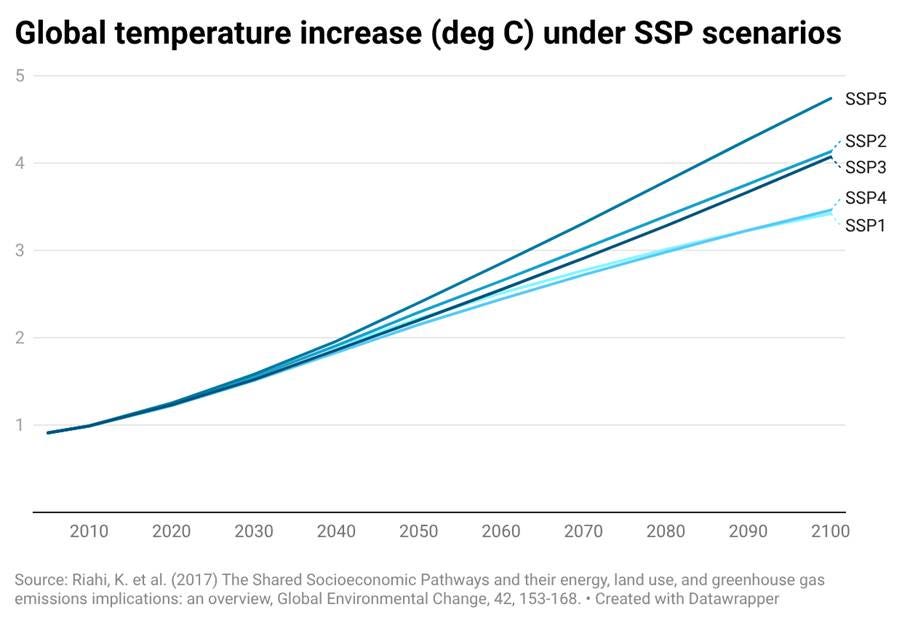
And here’s the impact on global mean surface temperatures:
Targets, policies and action
Each of the three sets of scenarios considered so far explores the impact of different courses of action on greenhouse gas emissions (or concentrations) and global temperatures. But what they don’t do is relate any of this to what we’re actually doing to reduce greenhouse gas emissions and to mitigate the impact of climate change.
Consequently, I’m a big fan of the Climate Action Tracker (CAT), which is an independent science-led project that monitors the actions that governments around the world are taking to reduce greenhouse gas emissions and to comply with the various agreements they’ve signed up to.
The CAT produces its own emissions pathway scenarios, which focus on:
what countries have said they’ll do;
what they are doing;
what they could do if they tried (the ‘optimistic scenario’); and
what they’d need to do to keep temperature rises below 1.5 degrees.
The likely impact of these different scenarios on greenhouse gas emissions and global temperature rises is as follows:
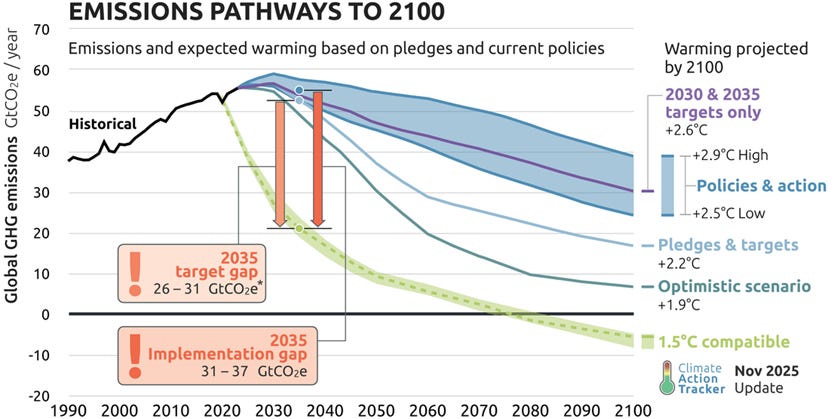
Source: Climate Action Tracker, https://climateactiontracker.org/global/emissions-pathways/
The CAT scenarios move beyond just the science of greenhouse gas emissions, to embrace the political aspects of what we’re actually doing about climate change. This makes them perhaps a little more challenging for scientists and politicians alike to embrace. But, in my view, they present us with valuable information in a clear and insightful way.
Limits and challenges
The scenarios that we’ve looked at here are, without doubt, informative and insightful. They give us a clear idea of the likely range of temperature increases over the course of this century, indicating that we can probably expect global mean surface temperatures to rise by between one and five degrees Celsius, depending on what and how much we do to rein in greenhouse gas emissions.
Each of these scenarios is based on complex, science-based and extensively peer-reviewed quantitative models. They draw on a fairly decent understanding of the impact of greenhouse gas emissions and other factors on global temperatures. But they are, nevertheless, models. They are simplified versions of reality.
While the models used by climate scientists are improving all the time, we don’t know everything. The potential impact of various climate ‘tipping points’ remains, in many cases, uncertain. Nations that had previously espoused commitments to reduce greenhouse gas emissions are, in some cases, rolling these back. And there is always the risk of ‘unknown unknowns’ – things we didn’t know we didn’t know.
The focus in the climate models on global mean surface temperatures also disguises the fact that temperature increases will not be uniform across the planet. A mean rise of two degrees might not sound that much (although it would, in fact, be fairly catastrophic), but it could easily result in increases in certain parts of the world of several times that.
The climate models also, in most cases, look only to the end of this century. However, climate change is not going to stop just because the calendar has reached a round number. Any warming trend is likely to continue, if we do not do enough to address the underlying causes. And so a two or three degree increase in temperature by 2100 would not be the end of the story. Not an issue for most of us, of course, but something of considerable concern to our descendants.
We must not forget, either, that climate change is not just about rising temperatures. Because such temperature rises will bring with them a whole host of other climate impacts, from physical changes to our weather patterns to political, industrial, economic and social challenges, from changing patterns of crop growth to climate-driven migration.
From data to action
These and other climate models remain, nevertheless, important. But our aim is not, ultimately, simply to get increasingly better models. To create an ever more precise picture of how bad things will get. That’s like rearranging the deckchairs on the Titanic.
We need to actually use what the models are telling us to take action. To mitigate against, to adapt to and to improve our resilience against the impacts of climate change.
Do any of the scenarios we’ve looked at here tell us what the future will look like? No, they don’t. But they do tell us how the future might look. At least, in terms of greenhouse gas emissions and global mean surface temperatures, which in turn drive many other climate impacts.
Being based on robust science and comprehensive modelling, they also provide us with a sound basis for getting to grips with where we’re at and for analysing how things might progress over the course of the rest of this century. They also, critically, provide us with insight into the likely range of climatic conditions for which we must prepare.